Ebsta's Native Email Sync automatically synchronises every sent and received email from connected mailboxes to relevant Salesforce records. You can therefore easily report on how many emails your team or a particular team member is sending and/or receiving each day.
Ebsta also provides full activity reporting that includes communications with Contacts not in Salesforce.
To create an Email Activity Report, Ebsta's Native email sync needs to be running for all users. If you haven't already set this up, please refer to the following article:
Set up Email Sync: An Administrator Guide
You will also need to have created Inbound/Outbound Activity Custom Fields and an Ebsta Sync Source field. If you haven't already done this, please refer to the following articles:
How to record email direction (Inbound/Outbound) when syncing to Salesforce
How to create an Ebsta Sync Source Field in Salesforce
Create an Email Activity Report in Salesforce
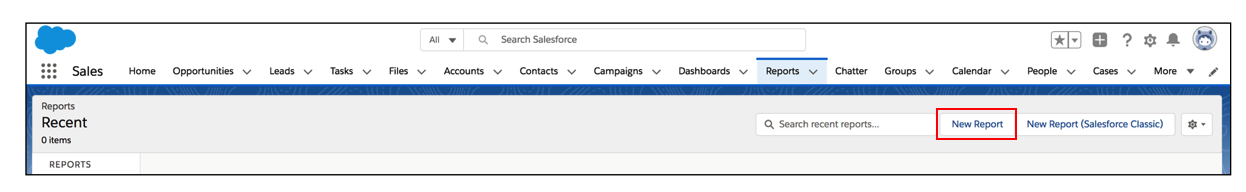
1. In Salesforce, click Reports > New Report
2. Select Activities > Tasks and Events and then click Continue.

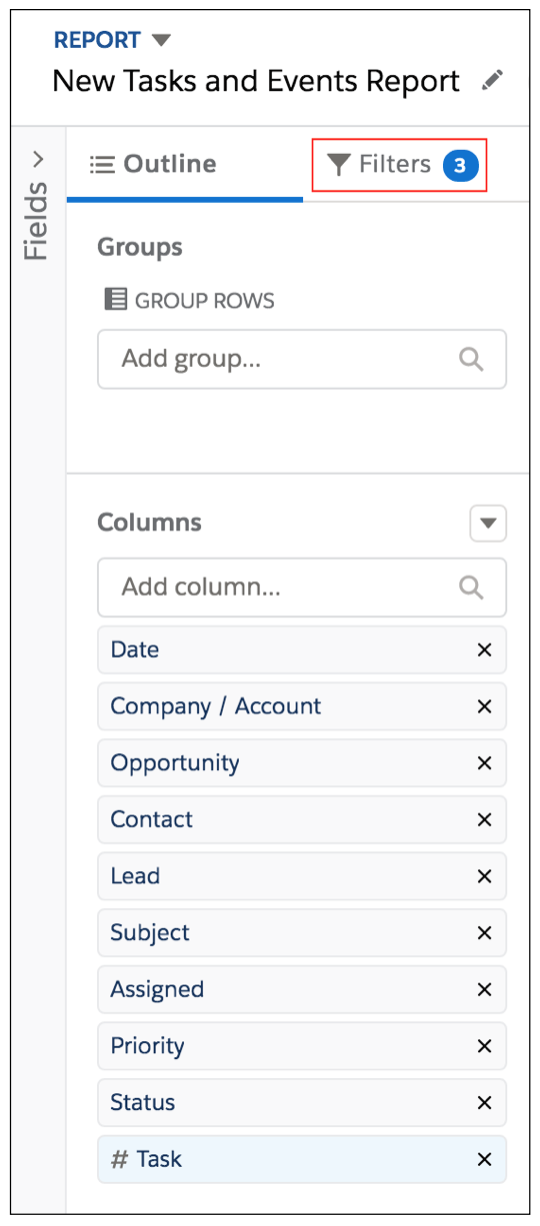
3. Click the Filters tab in the left hand menu.
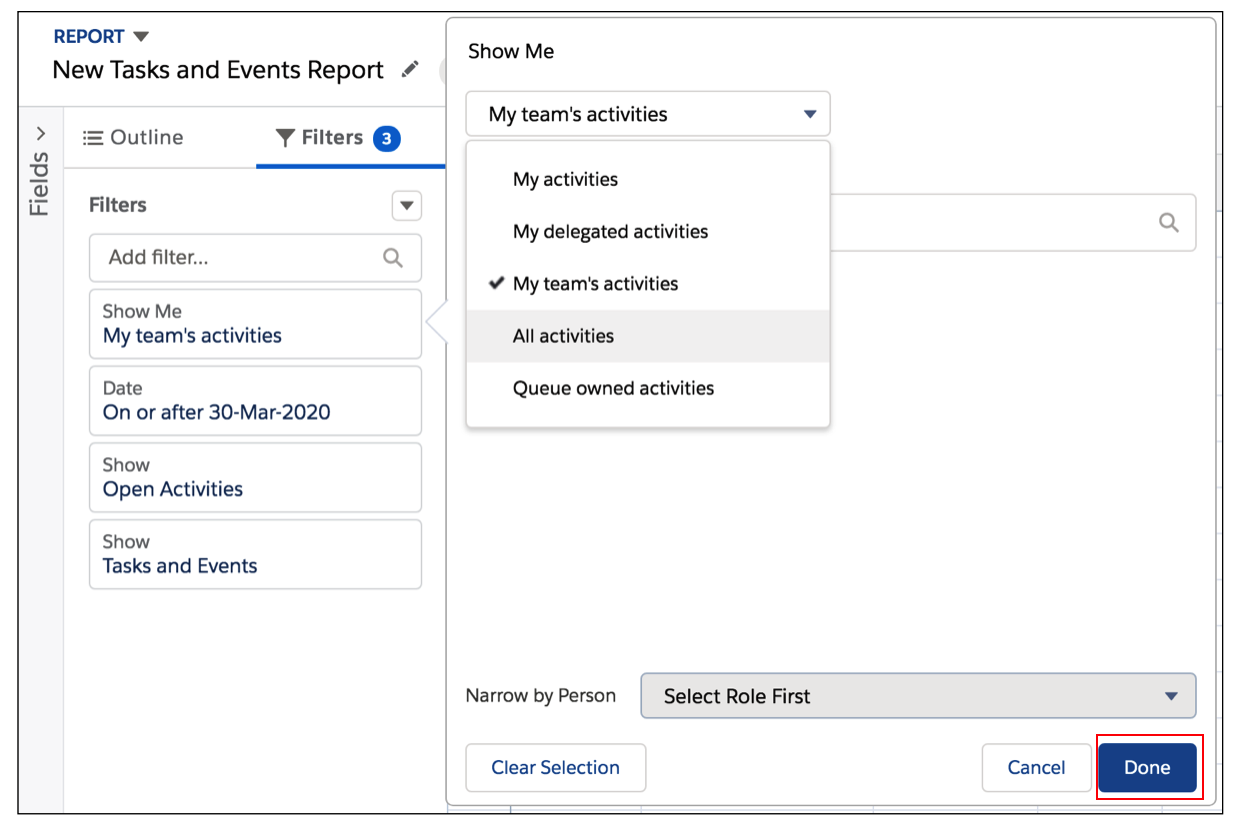
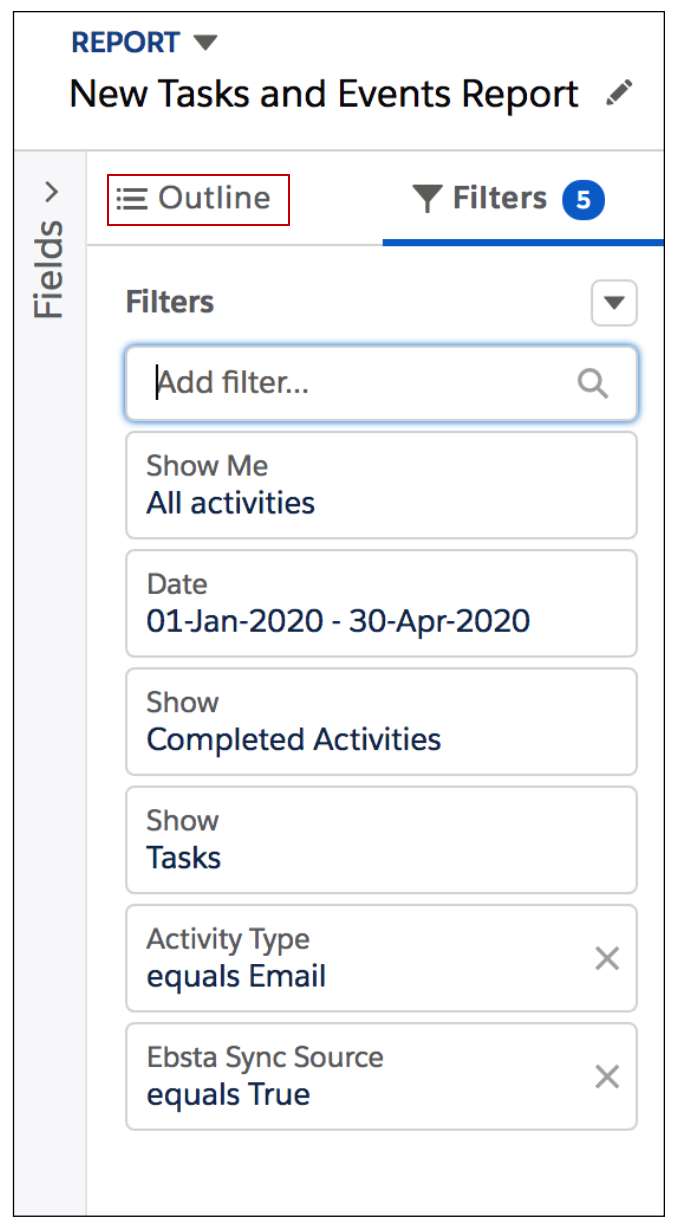
4. Change the Show Me filter to All Activities and click Done.
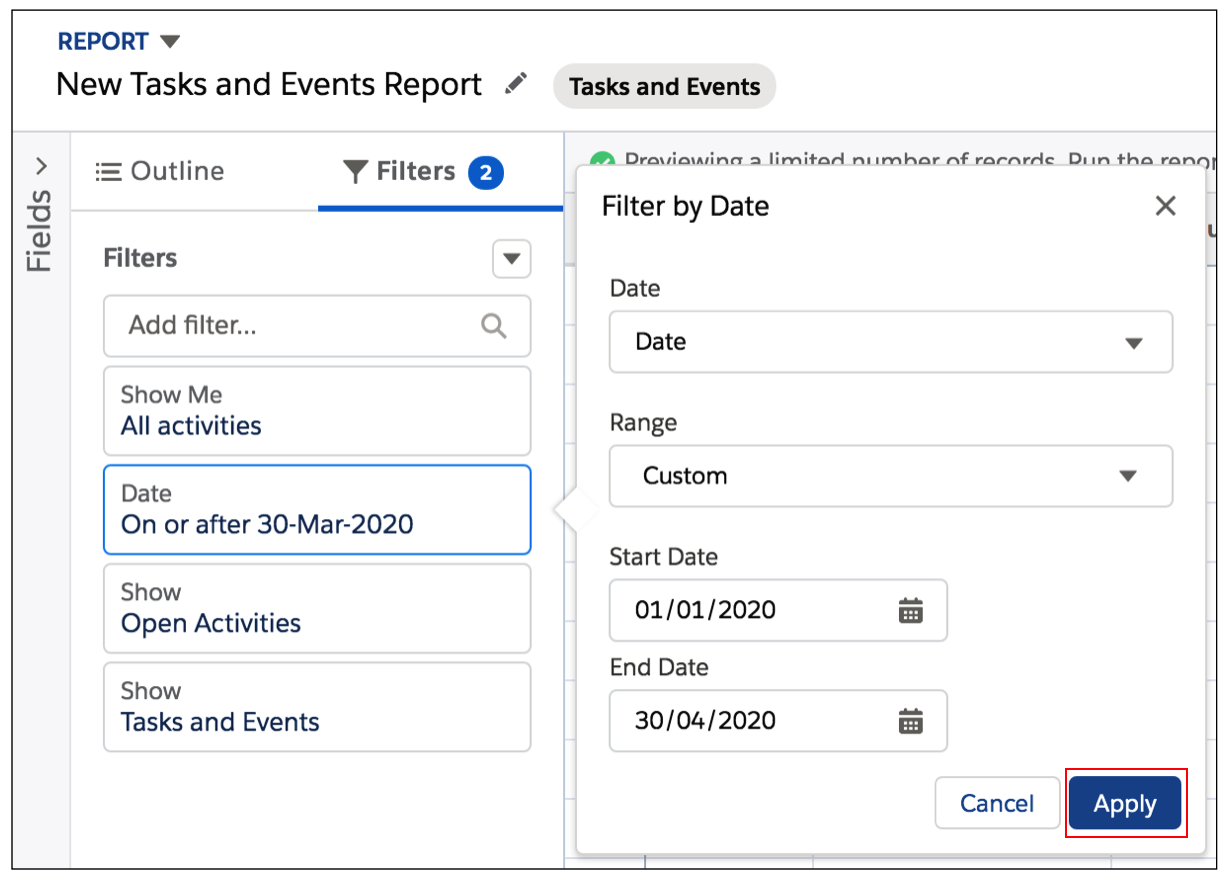
5. Click the Date filter and select a date range to report on and click Apply.
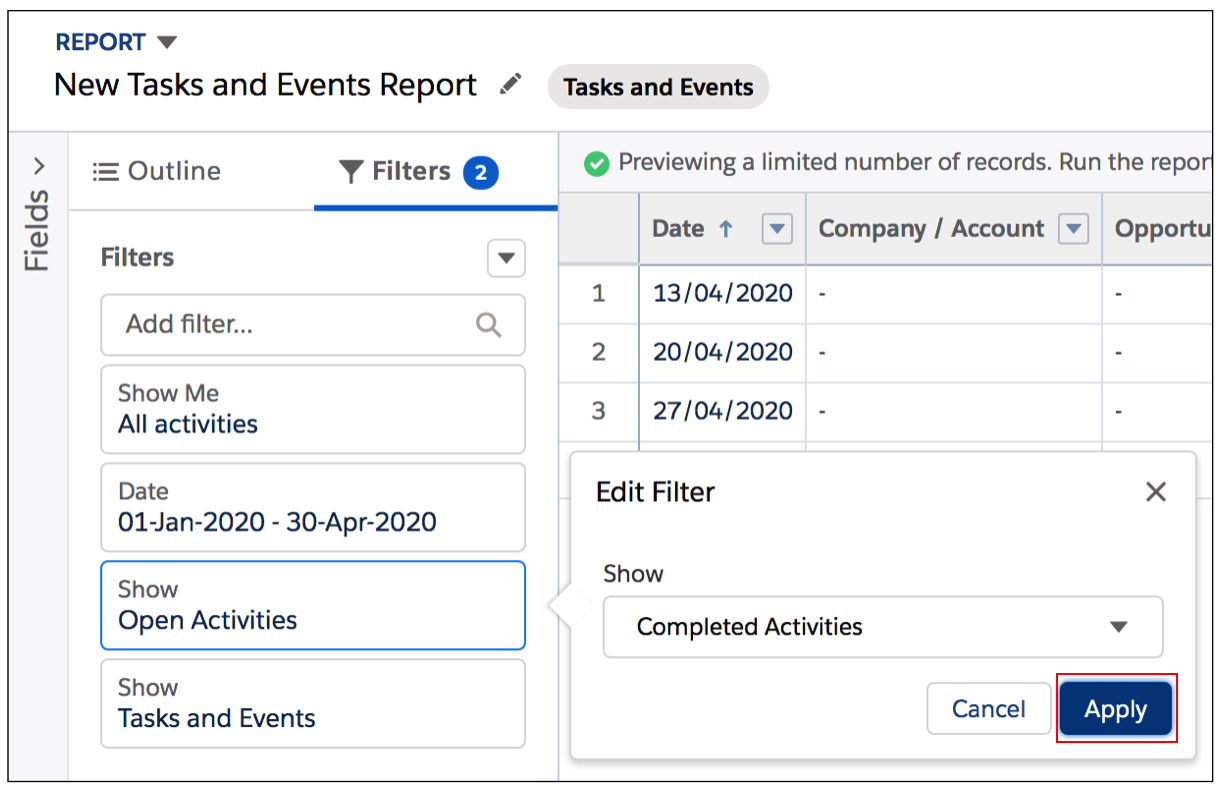
6. Change the first Show filter to Completed Activities and click Apply.
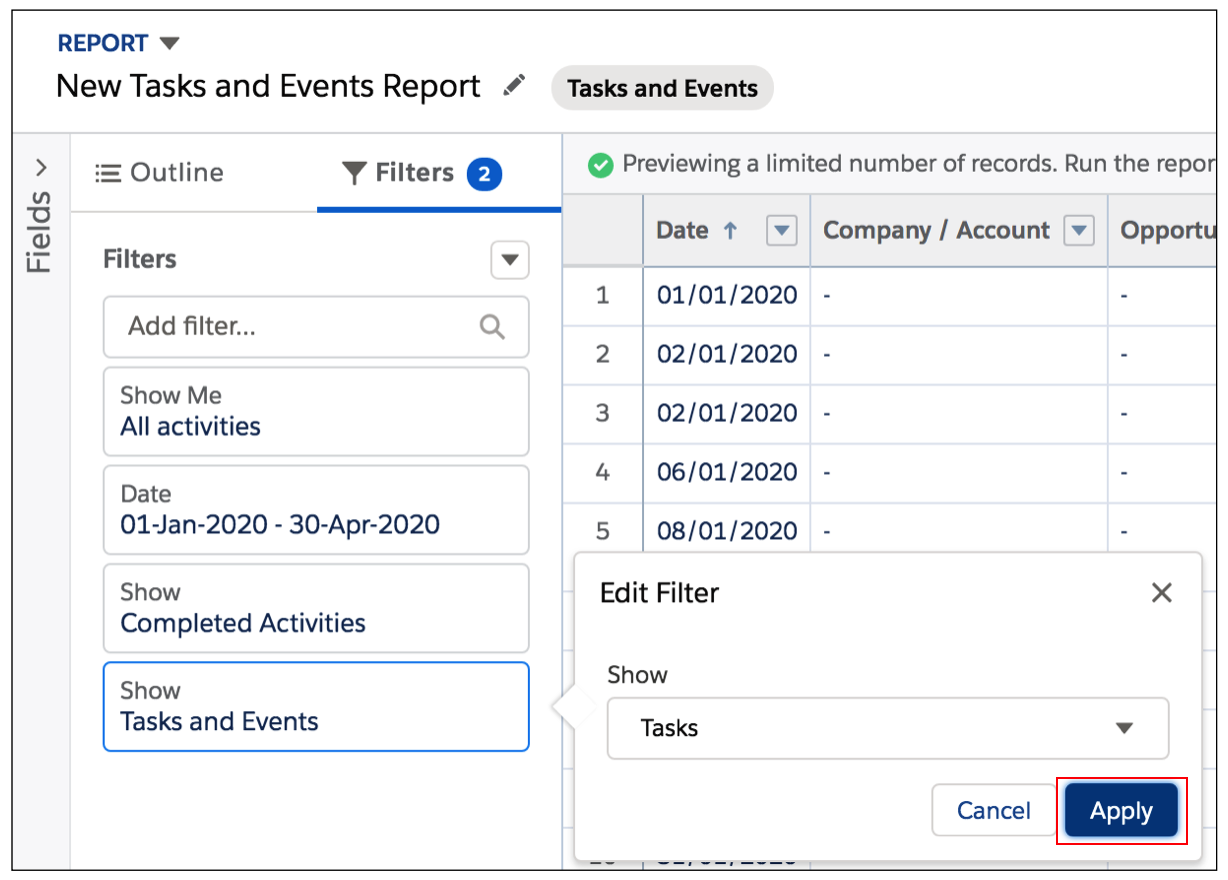
7. Change the second Show filter to Tasks and click Apply.
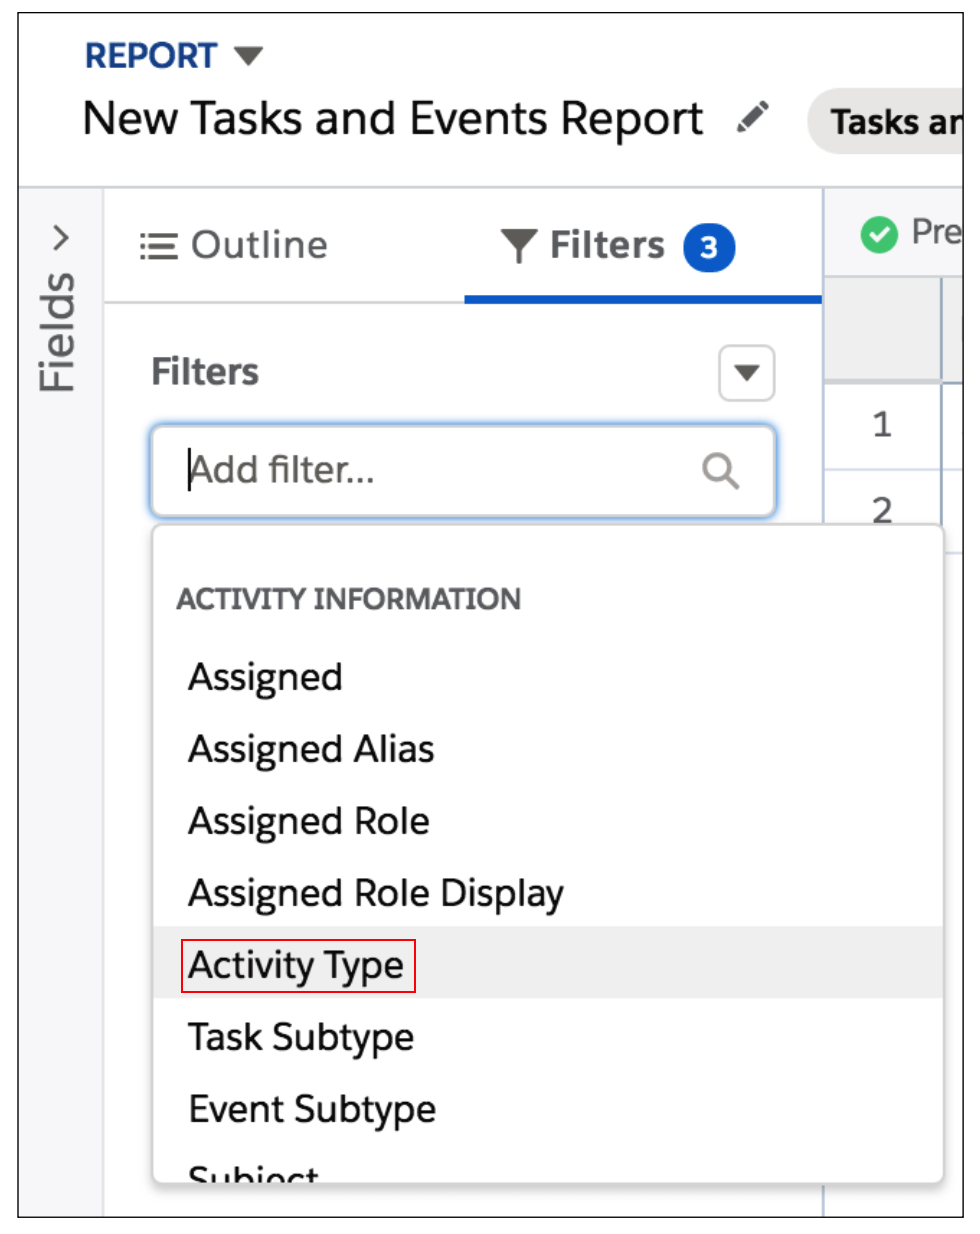
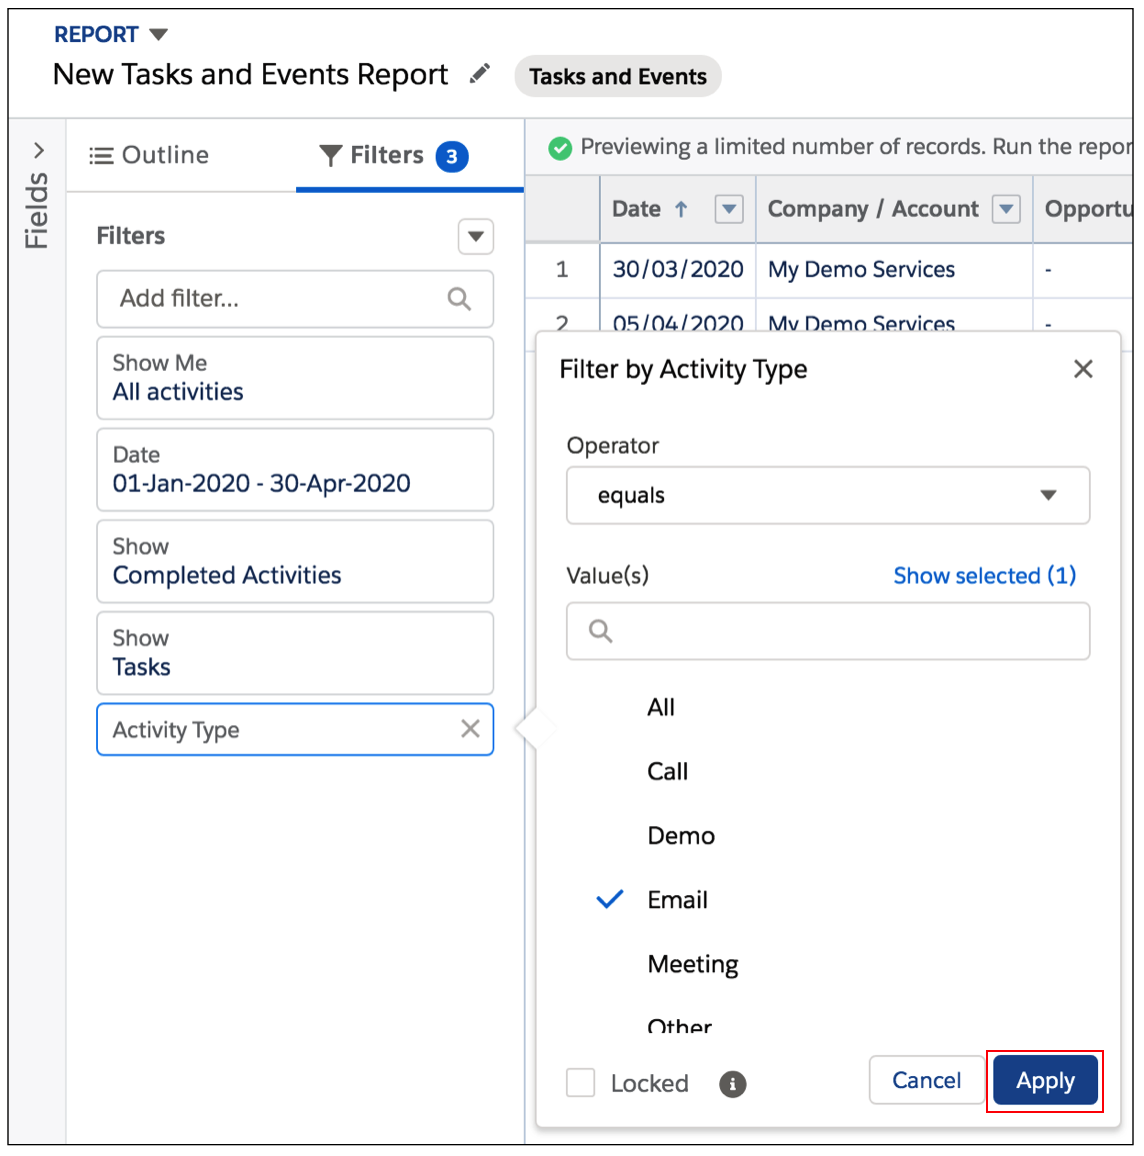
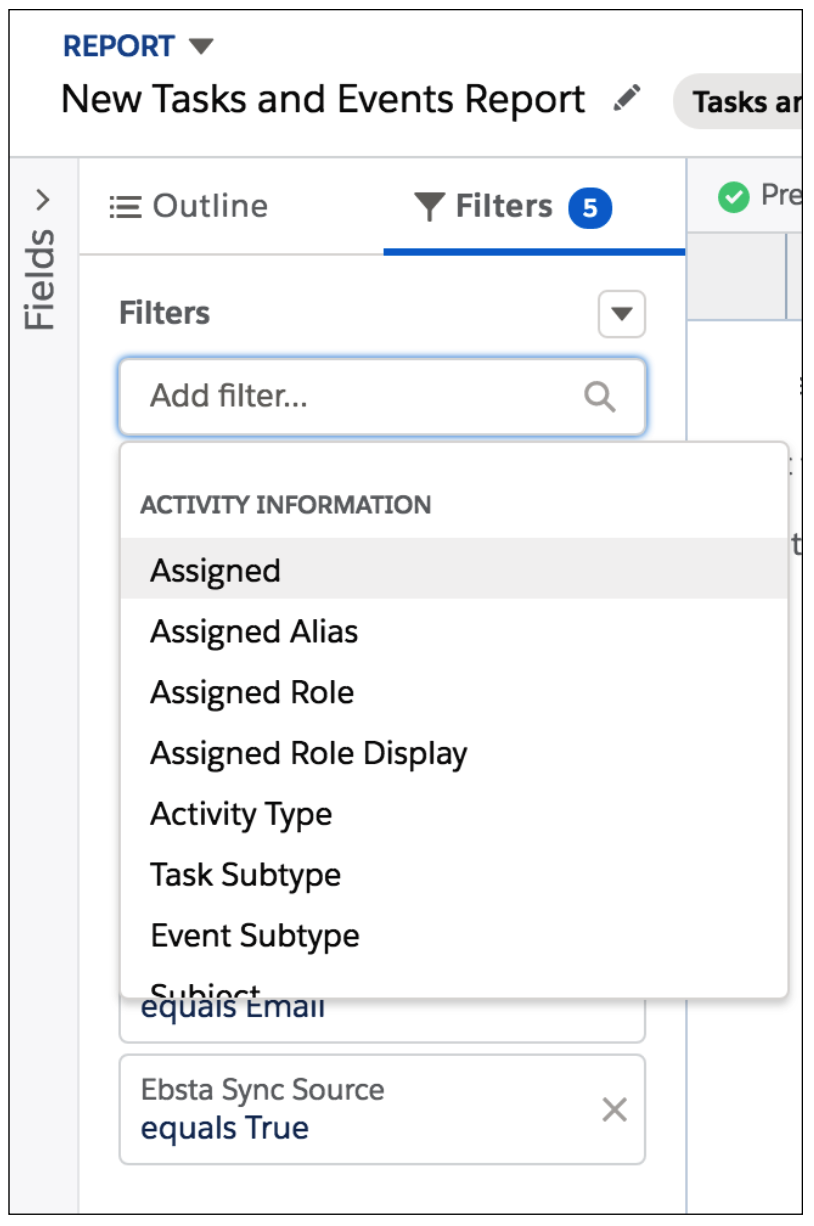
8. Click in the Add filter search bar and select Activity Type from the dropdown menu.
9. Select Email from the list and click Apply.
10. Click in the Add filter search bar and select Ebsta Sync Source* from the dropdown menu.
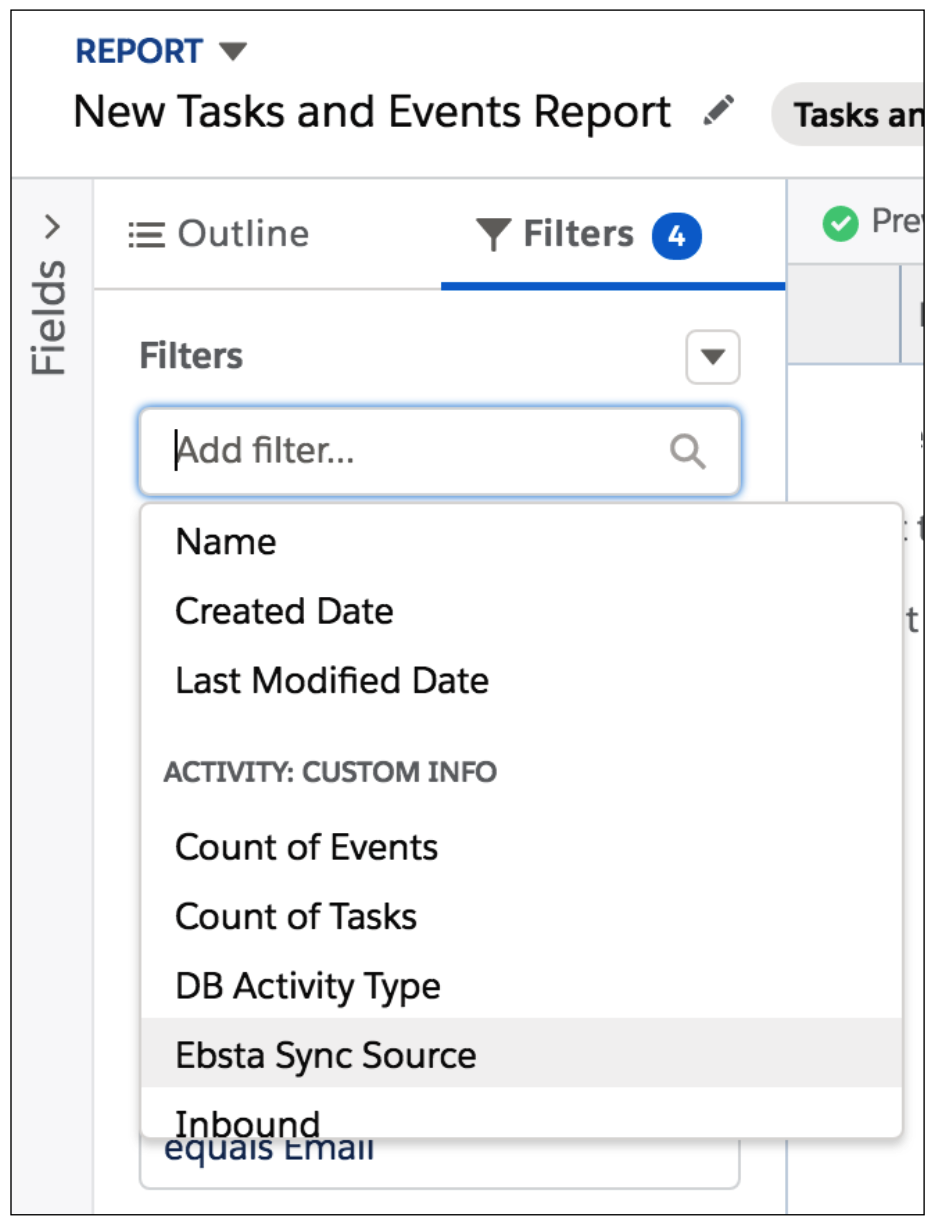
* Ebsta Sync Source is a Custom Field, if you haven't already created this, please refer to this article:
How to create an Ebsta Sync Source field
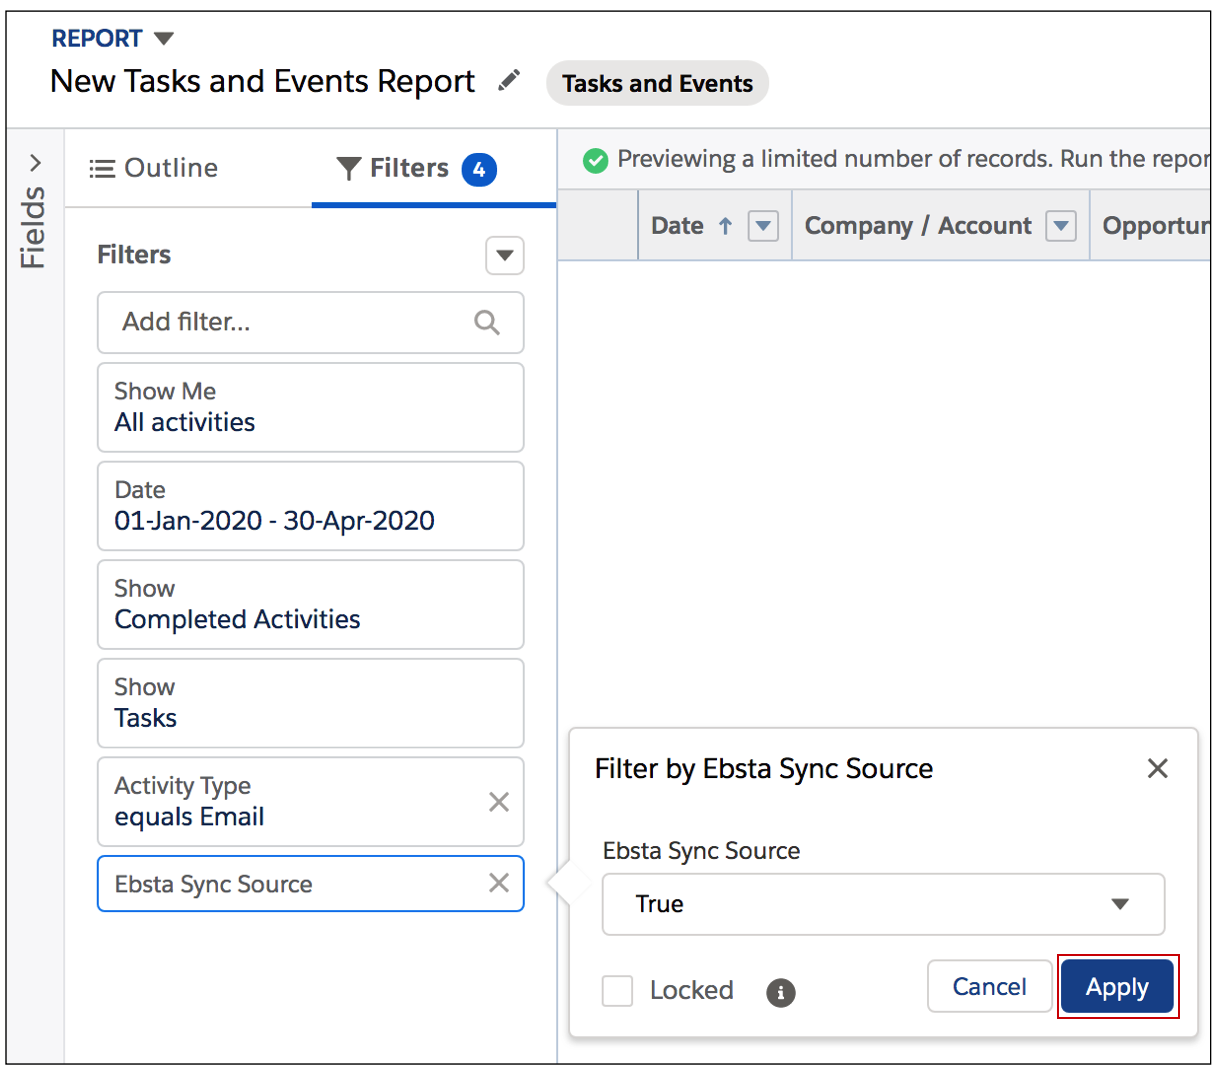
11. Select True from the list and click Apply.
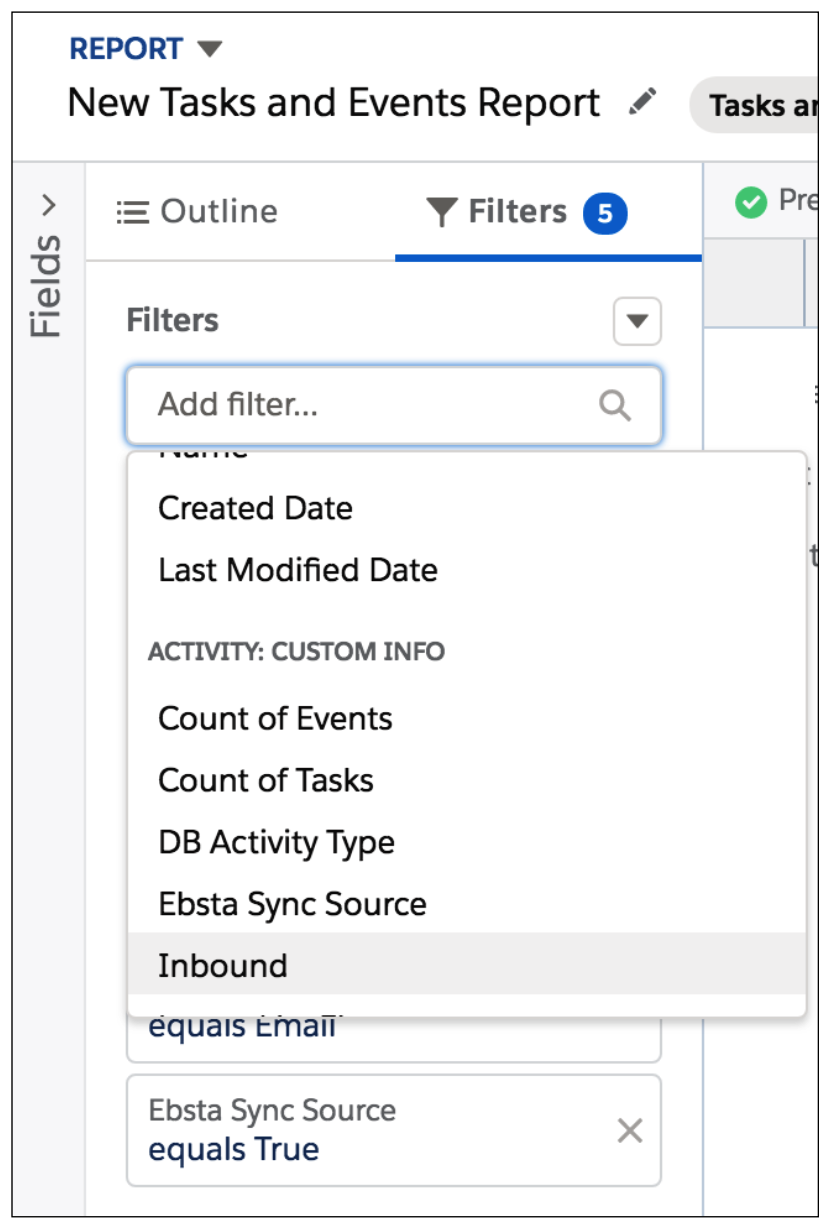
If you would like to report on just sent or received emails, you can add additional filter - either Outbound (Sent) or Inbound (Received) and set the value as 'True'.
You can also set up your report by User using an additional filter of 'Assigned'
12. Click the Outline tab
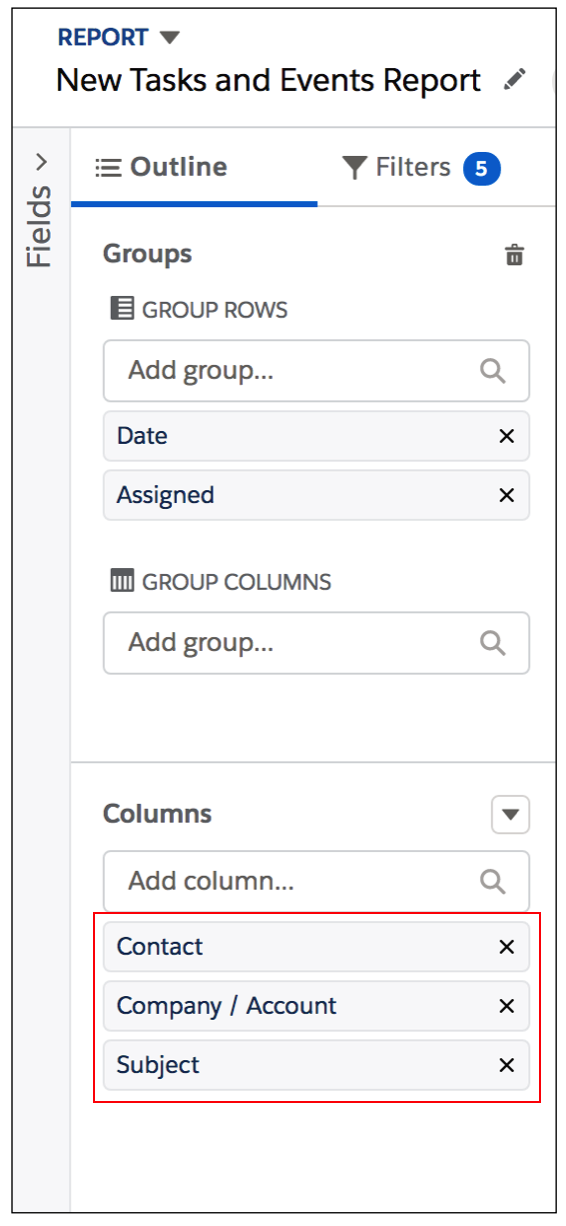
13. Click in the Add group search bar and select Date from the dropdown menu and then repeat selecting Assigned from the dropdown menu so that they both appear in Group Rows.
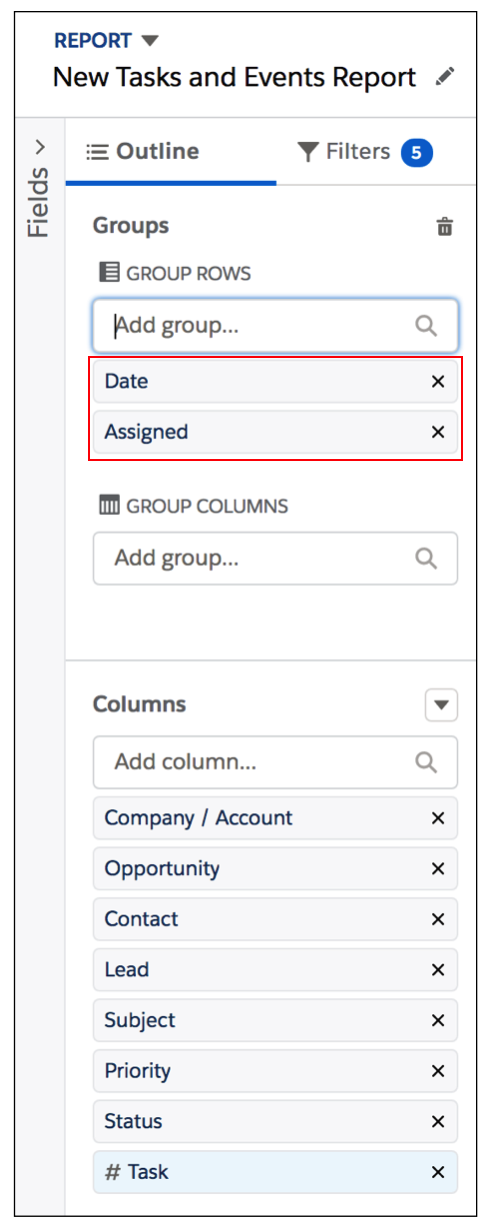
14. In Columns you can remove all fields except Contact, Company/Account and Subject.
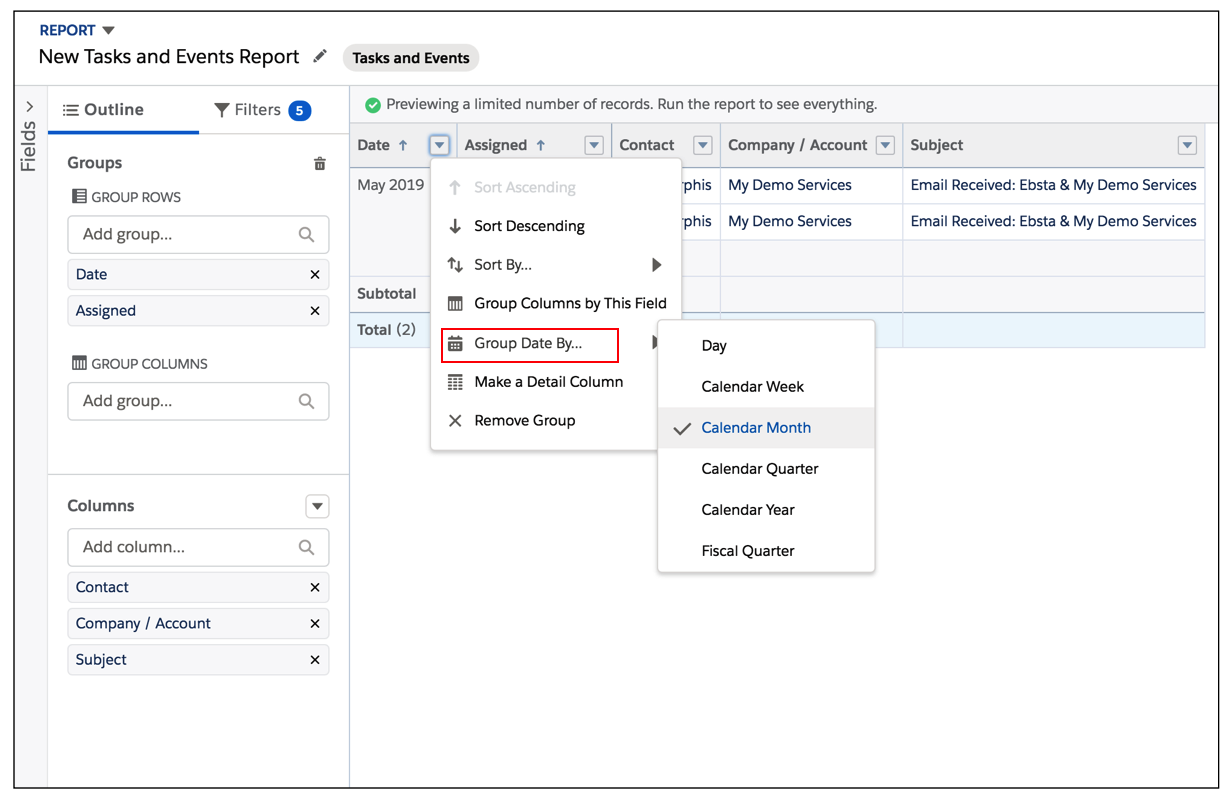
15. In the reporting area, click the down arrow next to Date column and select Group Date By from the dropdown menu and then select the time frame that you would like to group by.
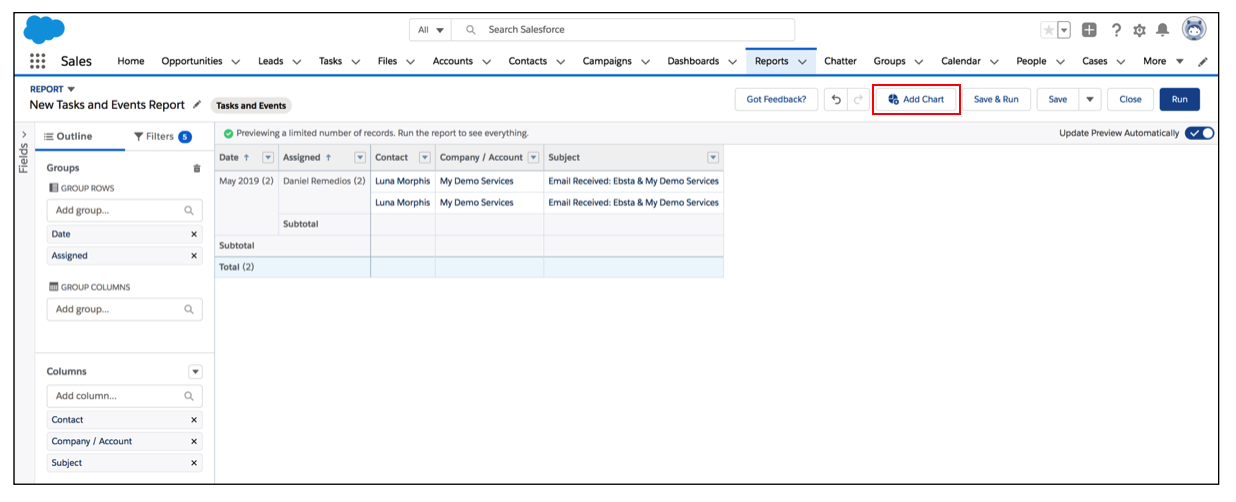
16. Click Add Chart in the top right hand corner.
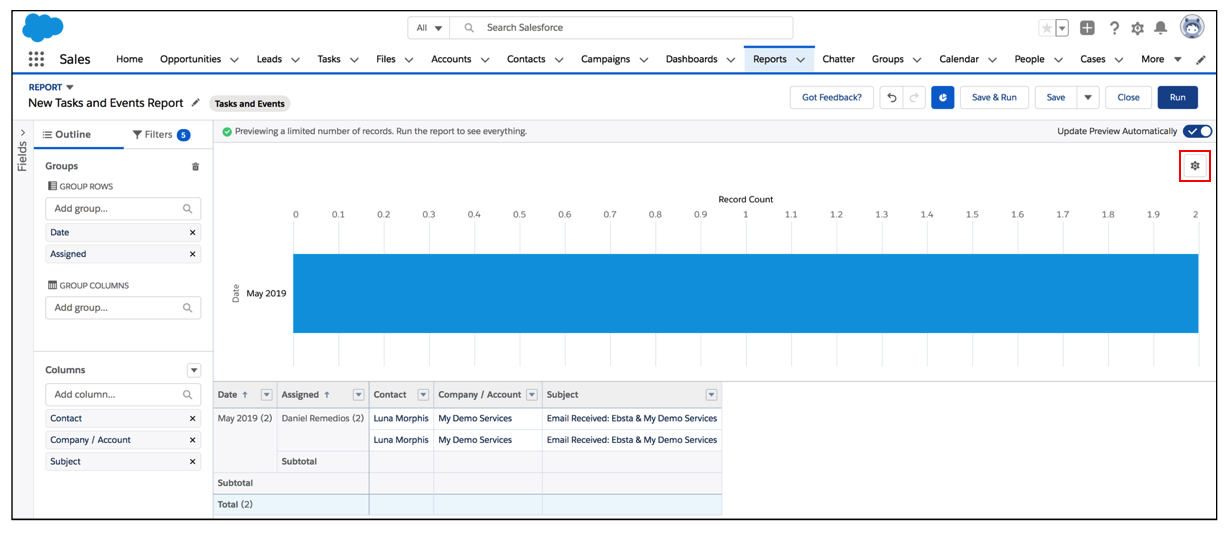
17. Click the Chart Properties cog button.
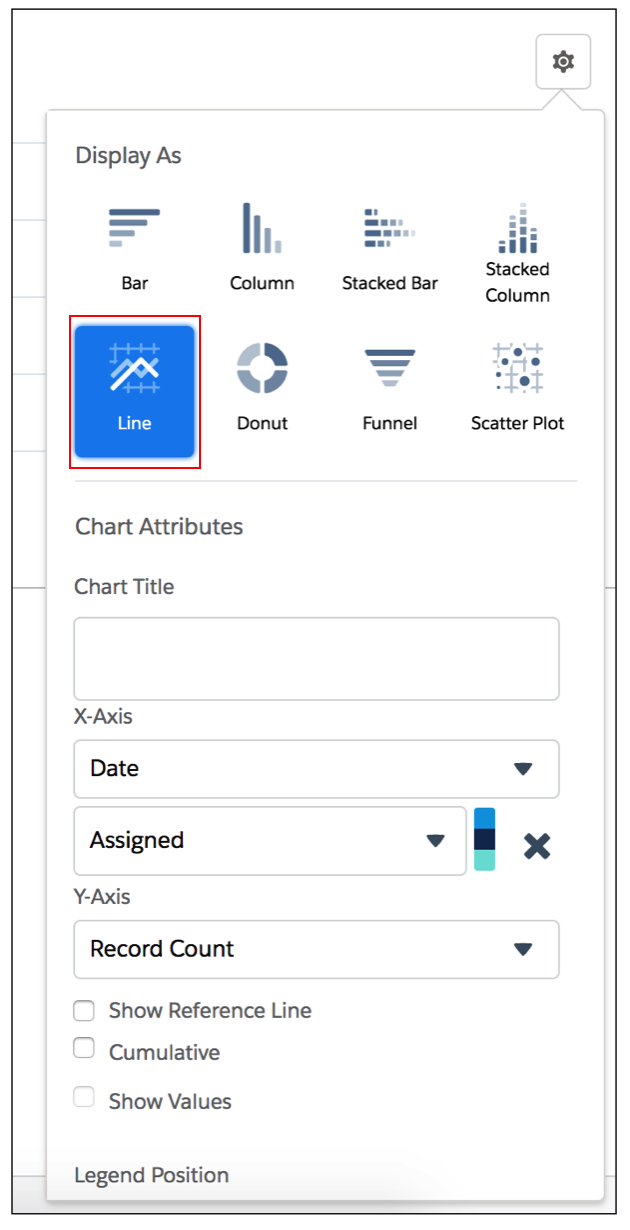
18. Select Line under Display As. Ensure Date is selected for the X-Axis - and you may also group User if you are viewing multiple Users - and Record Count for the Y-Axis. You can also chose to give the graph a title, display a Reference Line, show values and cumulative totals.
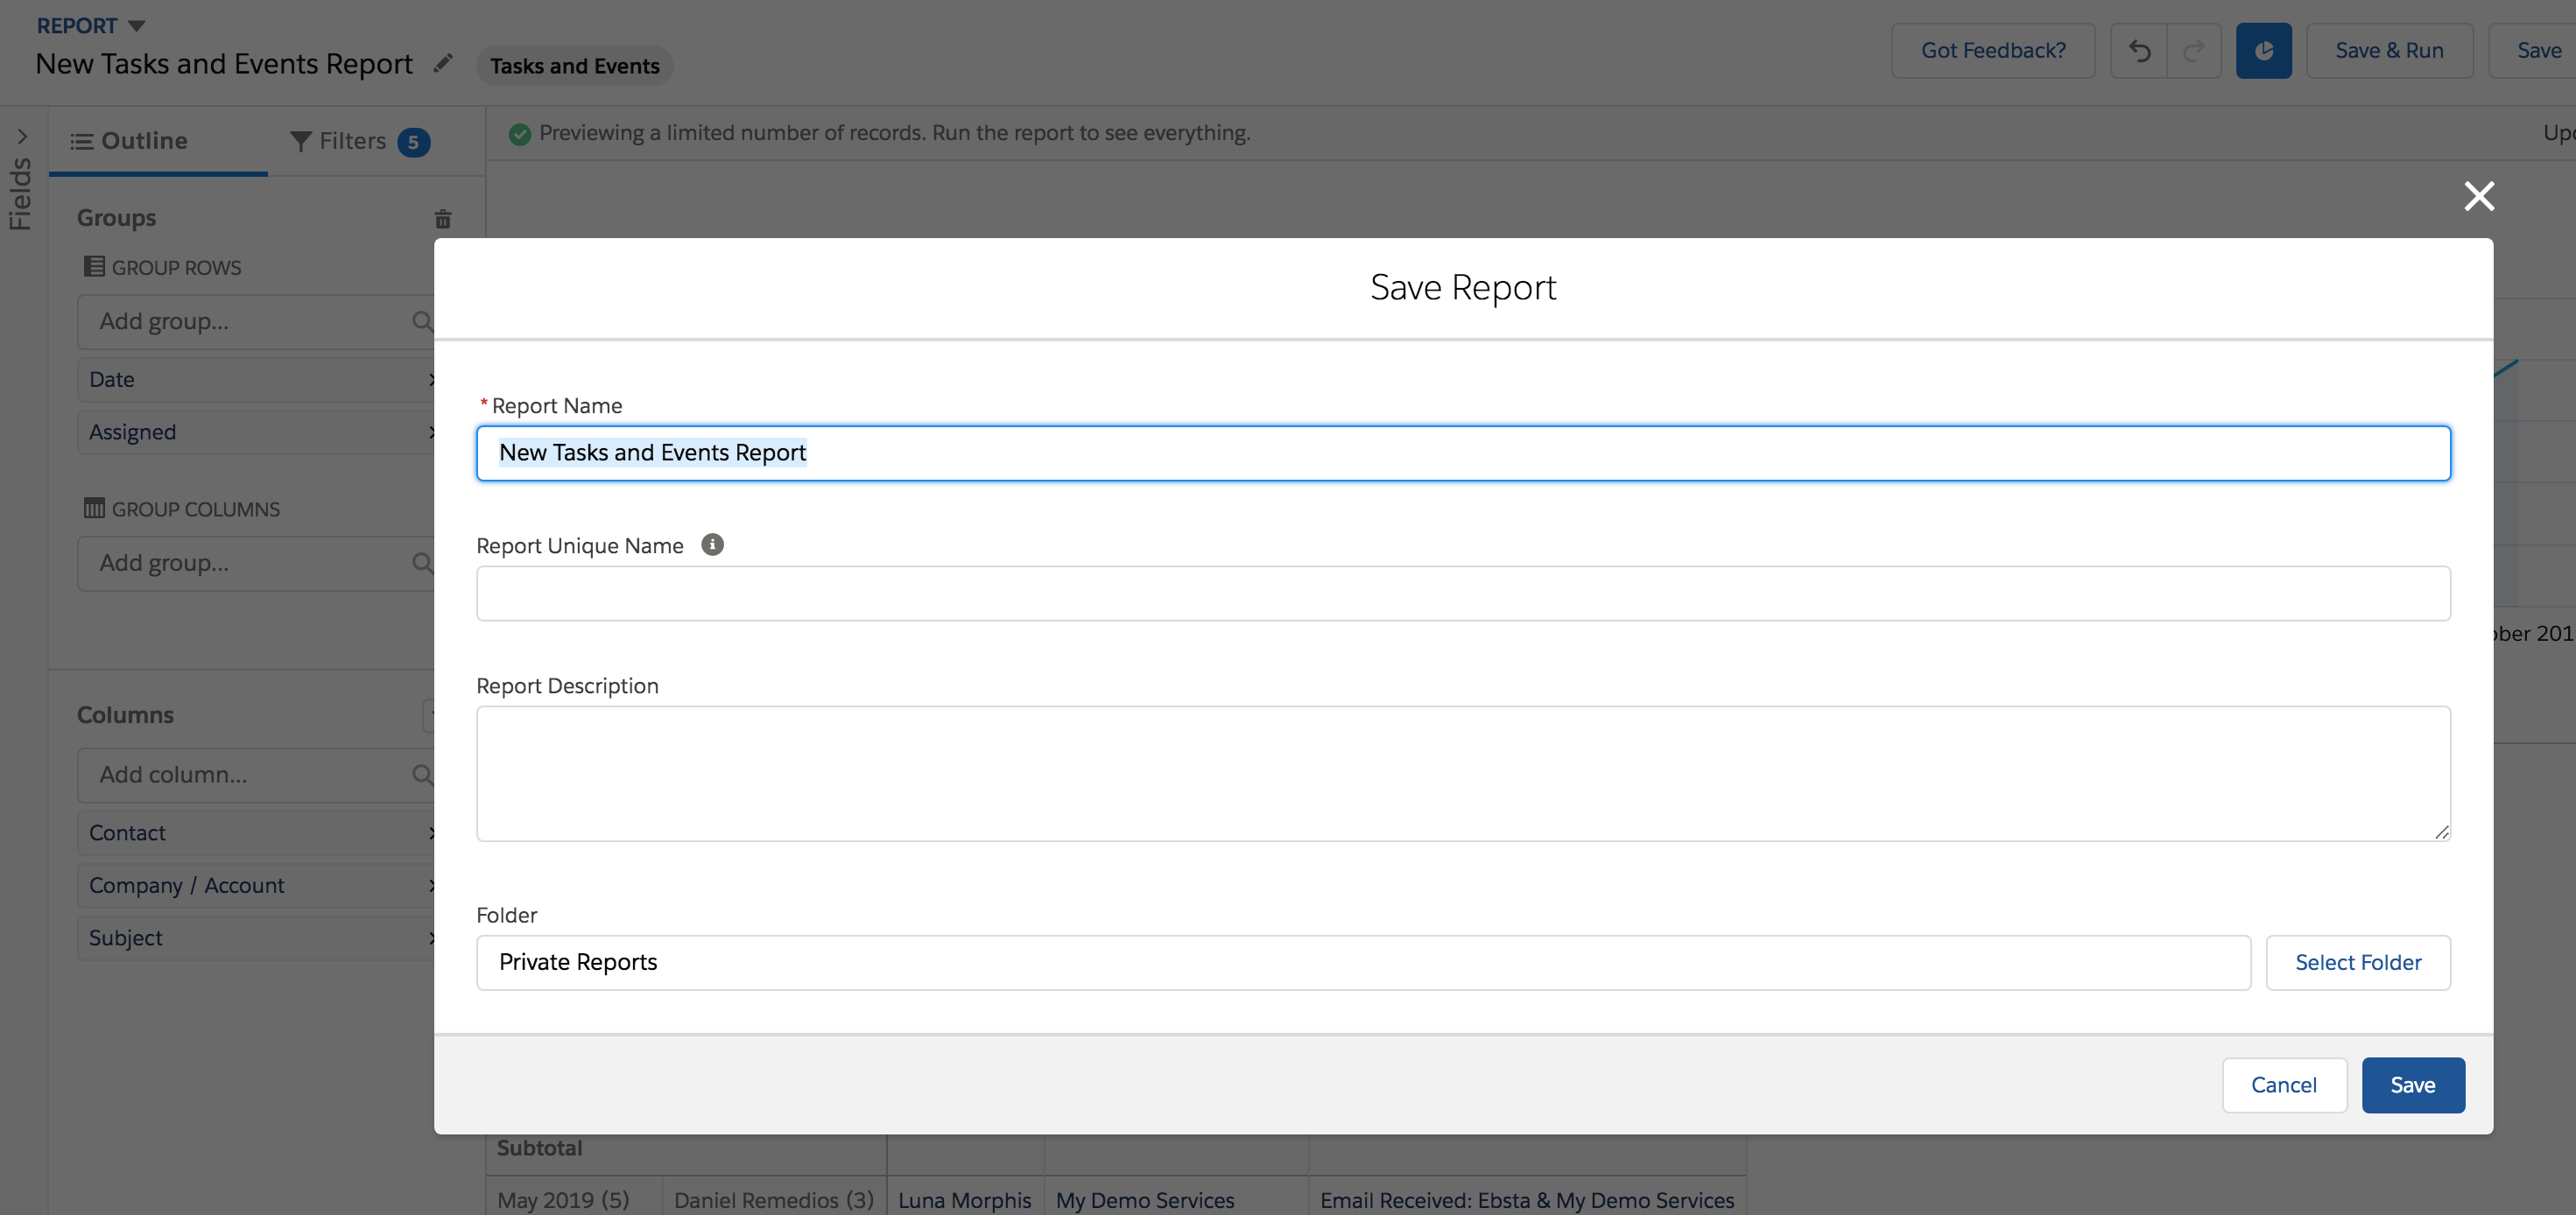
19. Click Save and Run
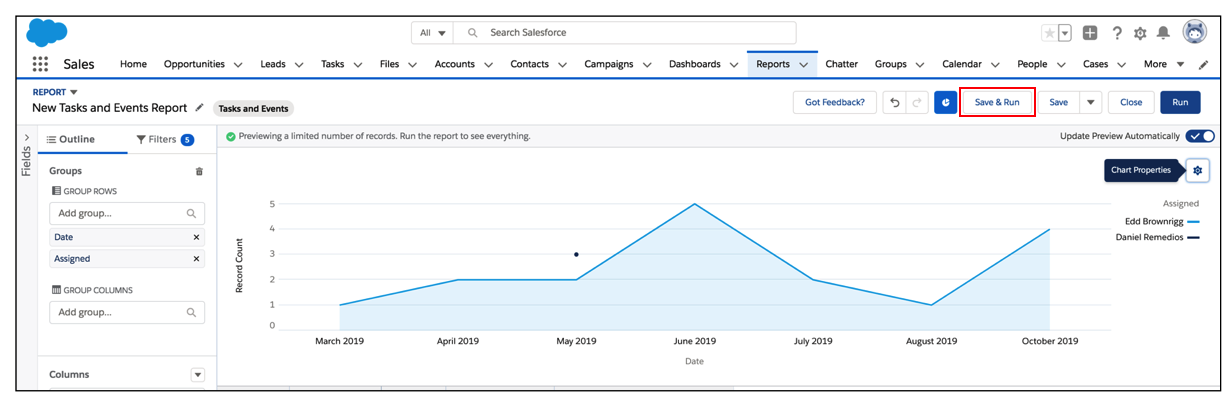
20. Give your Report a name and click Save.